Aircraft Noise Information
Presenting information on aircraft noise
There are many ways to present the impact of aircraft noise on the communities and locations around an airport. Information may relate to a single aircraft event or may be an average of all the events that occurred over a specified time period. Some single-event metrics capture only the maximum sound level perceived during that event whilst others capture the total sound energy level contained within a particular event.
ANCA will try to present information in a format that is easy to understand but where the use of technical terms is unavoidable, we will explain why we have used them and what they mean.
Noise Contours
Noise contours are lines on a map that connect points of the same levels of noise exposure. Contours are a standardised industry method of presenting the average aircraft related noise experienced (or projected to be experienced) by people living around an airport. They were traditionally calculated over a 16-hour period (07:00 – 23:00) during the busiest 92-day airport summer period from 16th June to 15th September. Contours may present information on what occurred in the past or depict projected future conditions.
The use of average noise contours facilitates: -
- an examination of noise exposure trends over time and the effects of aircraft noise;
- a comparison of different operating scenarios;
- an examination of the predicted impact of development proposals.
Why ANCA uses the metrics Lnight and Lden
The European Communities (Environmental Noise) Regulations 2018 (ENR) prescribes a common method for noise mapping to standardise assessments and make it easier to compare data across countries. These standards require the use of the night metric (Lnight) and the day-evening-night metric (Lden).
These metrics are also prescribed by the Aircraft Noise Regulation EU 598/2014 and are used as part of research and guidance in relation to impact of aircraft noise on health and quality of life.
Contour maps relating to situations or assessments carried out in accordance with these legislative standards will be in this format.
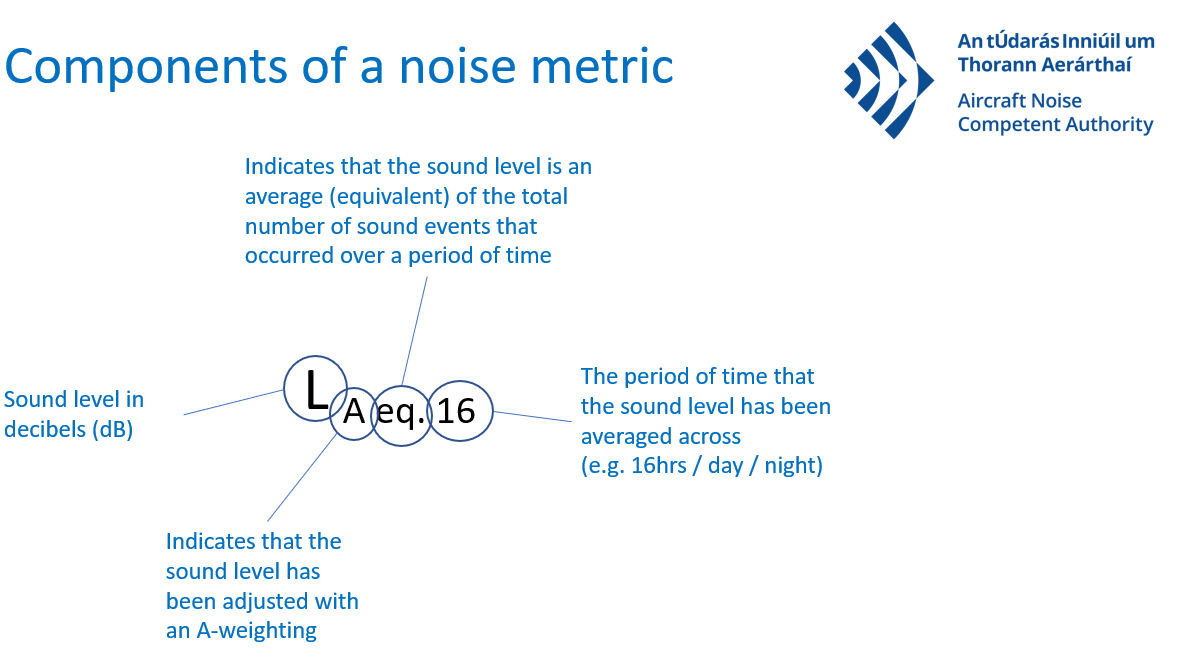
Why ANCA uses the metric LAeq.16
Some historical planning conditions associated with Dublin Airport (insulation schemes for example), relate to the busiest 92-day day-evening summer period metric LAeq16. Legislation permits the use of additional metrics such as this where they are relevant to local circumstances. ANCA will present information in the metric that relates to the relevant planning condition where appropriate.
What these metrics mean
Lden (day-evening-night noise level in dB):
the long-term annual average indicator in decibels, designed to assess annoyance. It refers to an A-weighted average sound pressure level over all days, evenings and nights in a year, with an evening weighting of 5 dB and a night weighting of 10 dB as noise is generally more annoying during these periods.
Lnight (night noise level in dB):
the long-term annual average indicator in decibels, designed to assess sleep disturbance. It refers to an A-weighted annual average night period of exposure.
LAeq.16 (day-evening noise level in dB)
the long-term average indicator in decibels, for the day-evening period during the 92-day busy summer period from 16th June to 15th September. It refers to an A-weighted average noise exposure over this period. This metric, in isolation, does not capture night-time noise and is often used in conjunction with an 8-hour night-time metric that is averaged over the same 92-day period (e.g. LAeq.8).
A-weighting:
Noise can be measured and evaluated objectively but humans have a different response to different frequencies. A-weighting is an industry agreed adjustment that is made to sound measurements to replicate the response of a human ear. It is generally represented as dB(A).
The periods of a day are defined in legislation as:
Day is 07:00-19:00; Evening is 19:00-23:00; Night is 23:00-07:00; 16-hour Day is 07:00-23:00.

Where you can go to get other metrics
Although contour maps are useful for assessment purposes, sound is not experienced in an averaged way and access may be needed to other metrics to assess the impact of individual aircraft events on your home or business. These are available on the website of the airport authority for Dublin Airport at:- https://www.dublinairport.com/corporate/corporate-social-responsibility/noise/airport-noise-noise-reports.
Contour maps for the home insulation schemes relating to Dublin Airport together with the average aircraft noise exposure contours are available at this link.